library(tidyverse)
library(palmerpenguins)

# brings 'penguins' dataset into name space
attach(penguins)
# brings 'penguins_raw' dataset into name space
attach(penguins_raw)Plotting Overview and Refresher
Resources:
Refresher
A more in depth intro to ggplot2 is covered in Data Carpentry - Data Analysis and Visualisation for Ecologists. This is a brief overview/refresher.
Setup
Basics of Plotting with {ggplot2}
The basic premise of ggplot is that there are 3 main components to a plot:
- the data
- a mapping of the data to aesthetics of the plot e.g. x or y axes
- this can be done for all layers of a plot at once by including it within the
aes()within theggplot()function - or to specific layers by using
aes()within a geom function
- this can be done for all layers of a plot at once by including it within the
- a geometric representation of the data e.g points, bars, boxplot
and the plots are built in layers
# general structure for a ggplot
ggplot(data = <DATA>, mapping = aes(<MAPPINGS>)) + <GEOM_FUNCTION>()ggplot(
data = penguins,
mapping = aes(x = body_mass_g,
y = flipper_length_mm)
) +
geom_point()Warning: Removed 2 rows containing missing values or values outside the scale range
(`geom_point()`).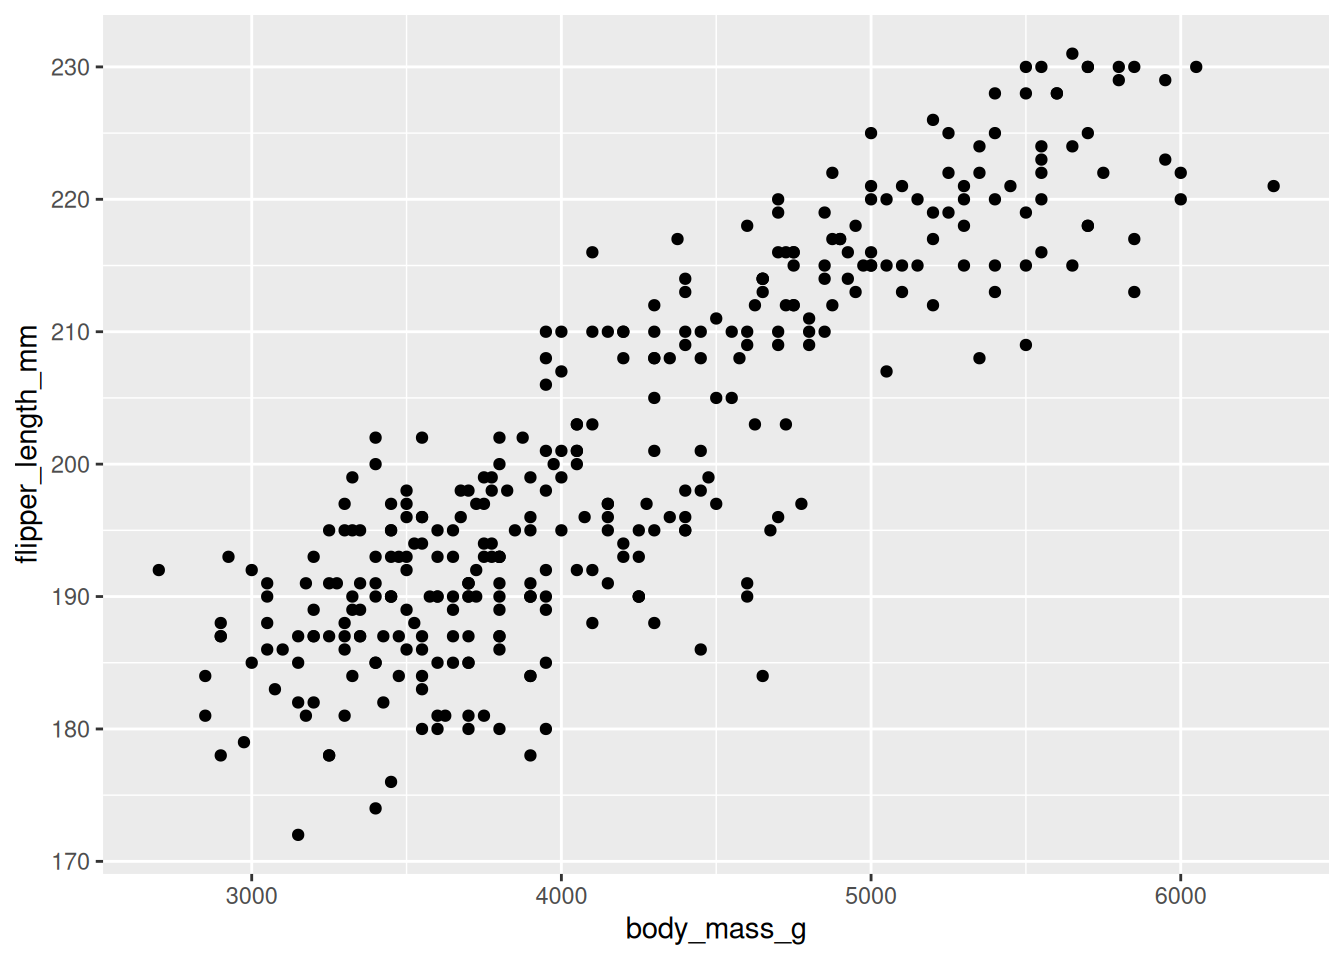
And we can modify the properties of layer to a specific value
ggplot(
  data = penguins,
  mapping = aes(x = body_mass_g,
                y = flipper_length_mm)
) +
  geom_point(colour = "blue")
Warning: Removed 2 rows containing missing values or values outside the scale range
(`geom_point()`).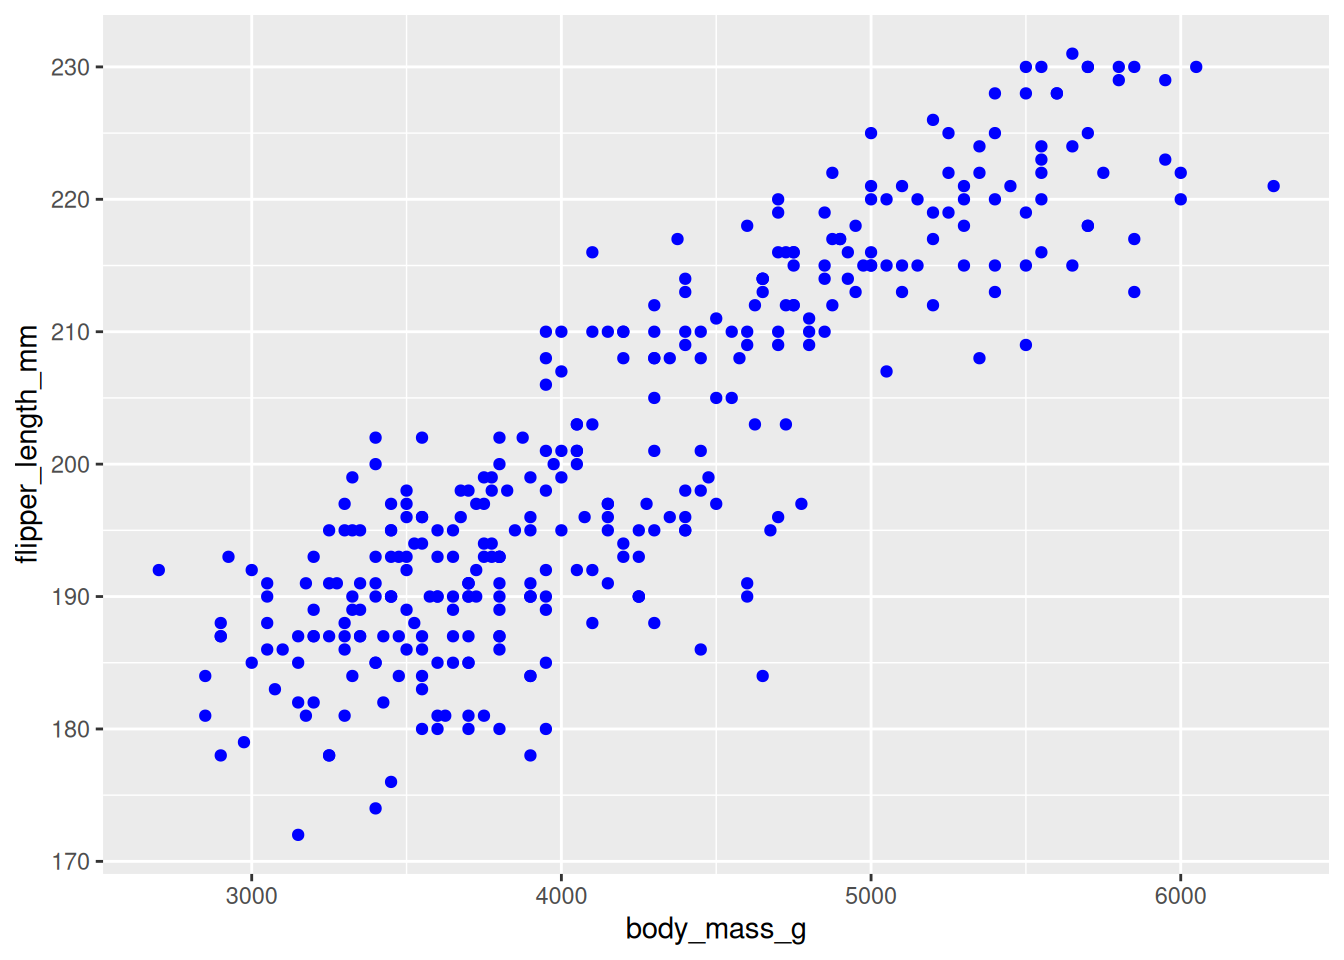
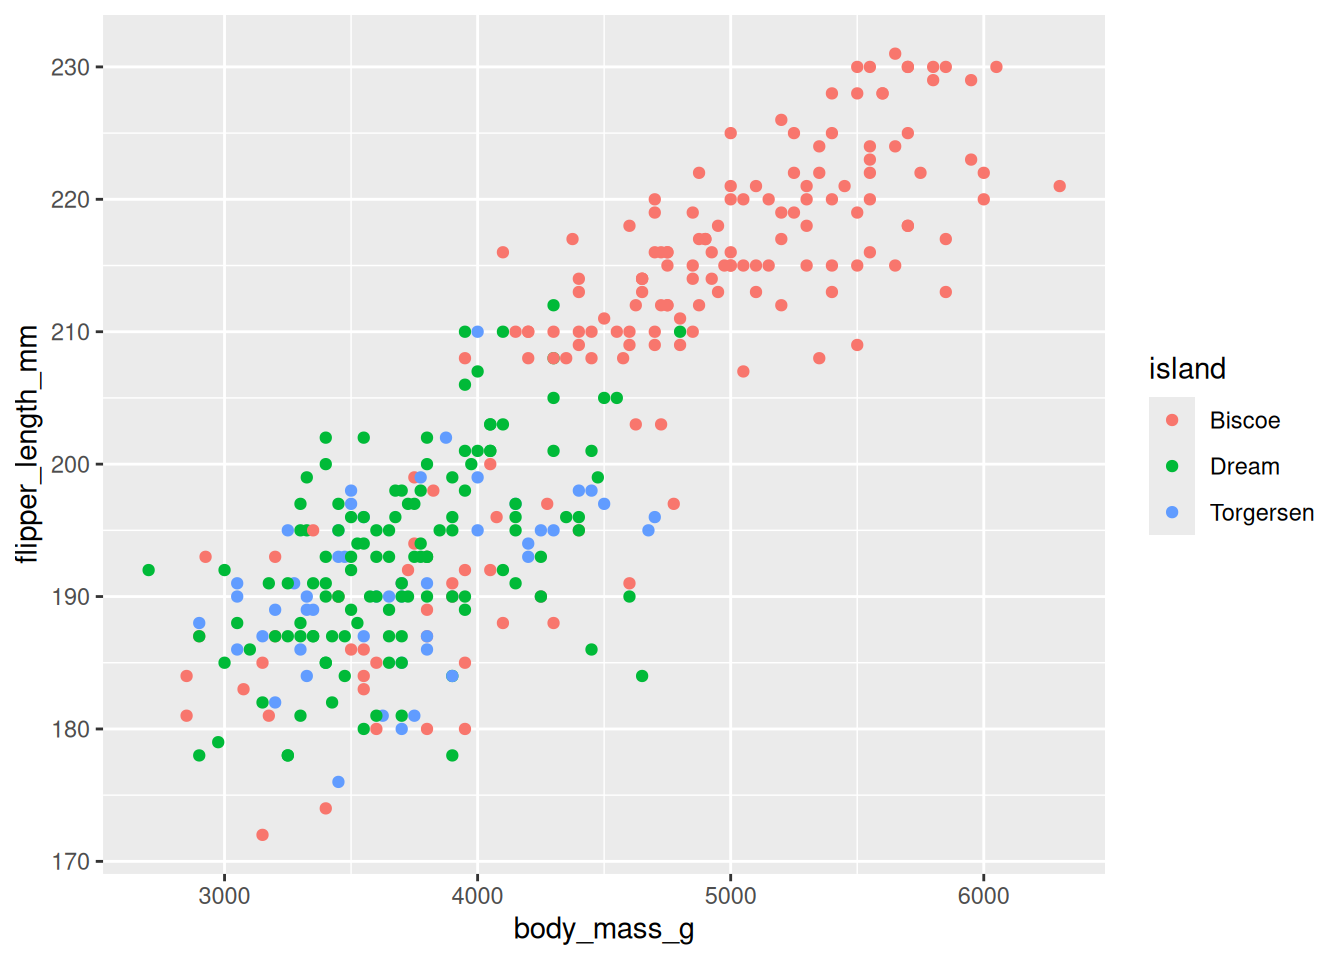
Or the property can be mapped back to the data - when this is the case we use aes()
ggplot(
  data = penguins,
  mapping = aes(x = body_mass_g,
                y = flipper_length_mm)
) +
  geom_point(mapping = aes(colour = island))
Warning: Removed 2 rows containing missing values or values outside the scale range
(`geom_point()`).
Plots can also be built incrementally by assignment
penguin_plot <- ggplot(
  data = penguins,
  mapping = aes(x = body_mass_g,
                y = flipper_length_mm,
                colour = island)
)

penguin_plot <- penguin_plot +
  geom_point()

penguin_plot
Warning: Removed 2 rows containing missing values or values outside the scale range
(`geom_point()`).